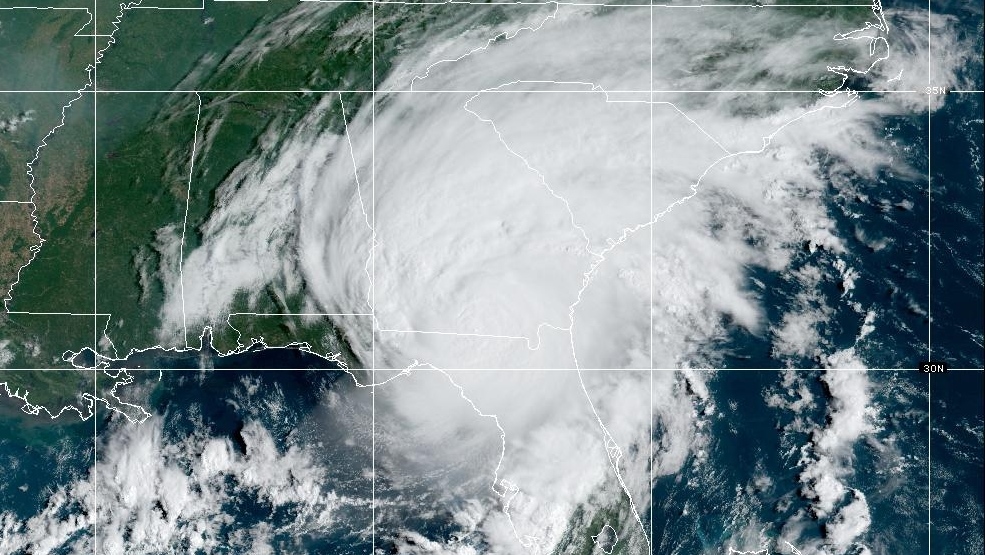
Hurricane Idalia has made landfall in the U.S. with “catastrophic storm surge and destructive winds” the National Oceanic and Atmospheric Administration says.
The storm is battering Florida’s coast and was downgraded to a category three, from a category four, hurricane shortly before making landfall.
As of 7 a.m. EDT winds were blowing at 201 kilometres per hour forcing waves into the communities of the Big Bend region, where they could reach as high as 4.5 metres.
Here’s what Hurricane Idalia looks like according to data from radar systems monitoring its destructive path. All maps and information are from the NOAA website tracking the hurricane.
The map showing lightening flash extent density along Hurricane Idalia’s path. (NOAA) The map above shows the hurricane at 8:11 a.m. EDT. The eye of the storm has crossed onto land, bringing with it strong winds, rain and lightning.
The colours show lightning flashes in the area every five minutes. Green is showing fewer flashes of lightning whereas red is for intense lightning episodes.
As the storm moved on land, lightning decreased.
 Rain in inches from Hurricane Idalia. (NOAA)
This map shows the inches of rain portions of the U.S. can expect with Hurricane Idalia.
The storm over the next day crosses into Georgia and South Carolina before decreasing in intensity as it heads back into the ocean.
This forecast shows parts of Tallahassee are expected to get the heaviest rain with around 254 to 381 millimetres of rain.
Idalia is expected to bring rain throughout its path with the most intense parts hitting inland communities.
 Air mass map showing how the atmosphere changes during a hurricane. (NOAA)
Hurricanes need three key ingredients before forming: warm water, steady wind and rapid evaporation.
The map above showcases how air masses move during a storm. Due to the components needed to create hurricanes, monitoring the air around it can showcase how it interacts with the atmosphere.
When drier, warm air is identified in the map the development of cyclones can be inferred.
 Wave heights along the coast of Florida from Hurricane Idalia. (NOAA)
Wind kicks up waves, which are called storm surges. They are an “abnormal rise” in sea level with a tropical storm, the NOAA website says.
The map above shows some areas of Florida can expect 3.6-metre and higher waves.
 Moisture map from NOAA showing Idalia’s path. (NOAA) Because moisture is important in the formation of a hurricane, maps like the one above show how much moisture is in the air.
The green colours are showing the clouds in the area. The white is excessive moisture following the hurricane as it travels. The purple has a higher moisture content than the white and is above water.
This map is used to track vapour, the jet stream and hurricanes.
 Map of all tropical disturbances in the Atlantic Ocean. (NOAA) Idalia is hitting land off Florida, as Hurricane Franklin moves northward in the Atlantic Ocean.
The map above shows the storms in the ocean with two hurricanes already formed.
A tropical depression, seen in the middle of the ocean, is a cyclone that has sustained wounds at 61-kilometre-an-hour winds.
Two other areas on the map show a likelihood of a hurricane forming.
The U.S. weather service is calling Idalia an “unprecedented event” due to the rarity of a storm like this passing through this particular region of Florida.

