The Lloyds (LSE:LLOY) share price has been climbing practically non-stop since mid-February, closing with a higher price for six weeks in a row recently. It’s now only a few pence away from breaking a new four-year high above 56p.
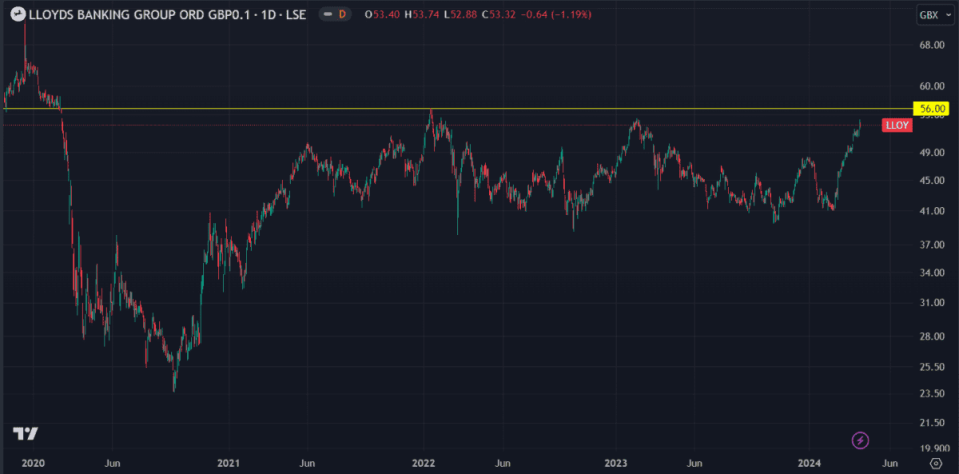

The last time it traded above that level was in February 2020 when the pandemic hit, knocking the price down from a high of 58p to 32p in less than a month. Lloyds came close to breaching this level in February last year but ultimately failed, so I’m wondering if this time is different.
Let’s see what the charts say.
UK market comparison
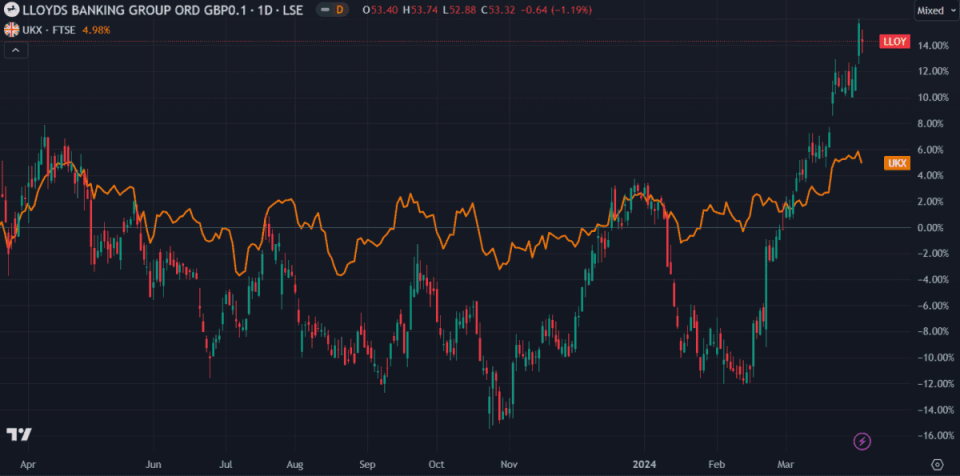
Lloyds recently overtook the FTSE 100 in percentage price gains, something it achieved briefly in January but has otherwise not done so since April last year. This indicates that it’s performing better than the average of the UK’s top 100 stocks. Whether or not this can continue is the question I hope to answer today.

Price-to-book ratio
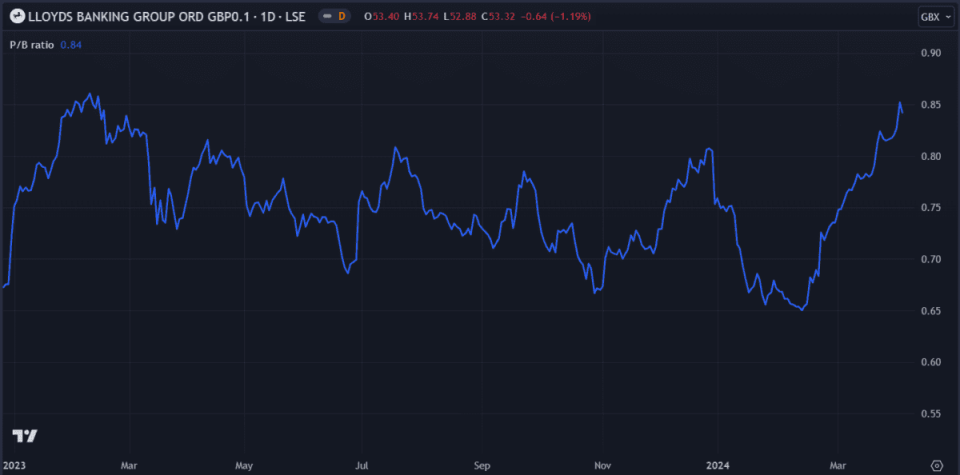
The price-to-book (P/B) ratio is calculated by dividing the current market price by the company’s book value per share. A high P/B ratio is typical in a bank with high expected earnings growth and high returns on equity.
Lloyds’ P/B ratio has been rising along with the share price since mid-February. Although it’s still in a good range, it’s nearing a value of 1, at which point the price could be considered overvalued. For now though, the P/B ratio of 0.84 suggests Lloyds shares could still climb further.

Return on equity
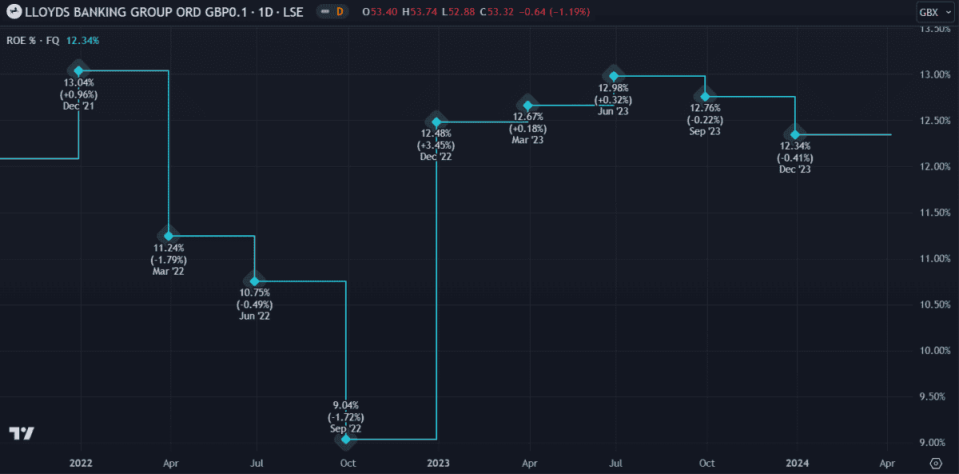
Return on equity (ROE) is a good indication of how well a company is performing based on its equity. In other words, how much profit it generates compared to the level of investment that shareholders have put into the business. While ROE doesn’t directly correlate with price, it’s a reassuring indication of a company’s operating strength.
ROE is calculated by dividing the company’s net income by its shareholder’s equity. Lloyds reported a decent ROE of 12.34% in its 2023 annual earnings report. Anything under 10% would be concerning.

Relative strength index
The relative strength index (RSI) is an oscillator used to measure the volatility of an asset’s price movements. It can be used to forecast price targets by gauging how a stock’s price is trending.
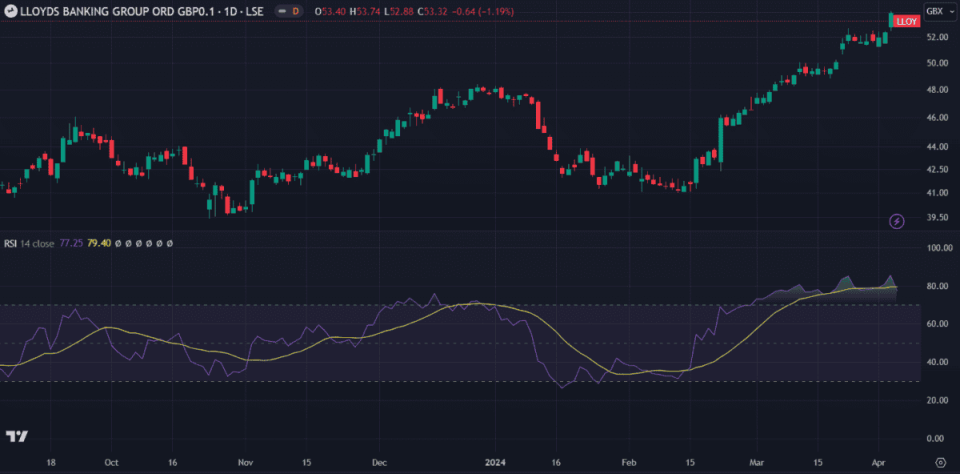
The oscillator ranges between zero and 100, with 30 and 70 being key levels dictating whether an asset is overbought or oversold. A prolonged move above 70 is usually a sign that the asset is overbought and could decline soon.
Looking at a daily chart, I see that Lloyds’ share price declined in early 2024 following a period when the RSI ticked above 70 a few times. Looking ahead to today, I see the RSI has been above 70 for over a month now. From my point of view, it would be difficult to argue that a correction isn’t imminent.

My verdict
Lloyds seems to be performing well at the moment, with the recent price gains likely boosted by the news of delayed rate cuts. While interest rates remain high, banks usually continue to profit.
However, several metrics indicate the price is overbought. While the shares could still make some gains in the short term, I wouldn’t buy them at this level.
The post Up 30% in 2 months, the Lloyds share price is nearing a 4-year high! appeared first on The Motley Fool UK.
More reading
Mark Hartley has no position in any of the shares mentioned. The Motley Fool UK has recommended Lloyds Banking Group Plc. Views expressed on the companies mentioned in this article are those of the writer and therefore may differ from the official recommendations we make in our subscription services such as Share Advisor, Hidden Winners and Pro. Here at The Motley Fool we believe that considering a diverse range of insights makes us better investors.
Motley Fool UK 2024

